
November is Long Term Care Awareness Month, a month dedicated to educating Americans about the financial and emotional burden that long term care may bring to them or their families.
Our goal is to raise awareness to help Americans realize the importance of planning for long term care early since many of them lack the sense of urgency in planning for their future care needs. ALTCP also wishes to instill the necessity of preparing for long term care considering that it is very costly. This is the best time to reach out to your loved ones who are putting off long term care planning and in the process places their savings and families at risk.
In line with Long Term Care Awareness Month, we curated a list of long term care statistics that can shed more light on the need for long term care planning and insurance that would cover care expenses.
Long Term Care
- 12 million: Americans receive long term care at home, in a community or in an institutional setting. Approximately 600,000 of these are children, 5.4million are non-elderly adults and 6.7 million are elderly. This is projected to double to 27 million by 2050.
- 52%: Americans turning 65 today will develop a disability serious enough who will need some type of long-term care services in their lifetimes.
- 20%: Americans 65 and up will need long term care for longer than 5 years.
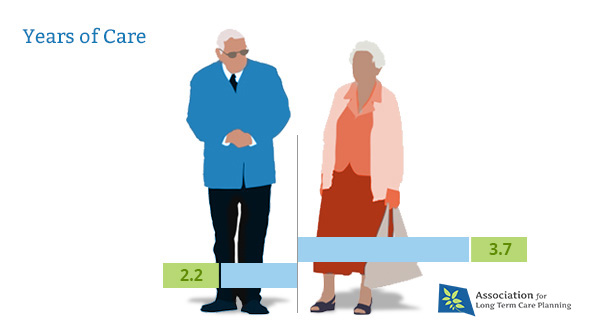
- 3.7 years: Average number of years a woman would need long term care.
- 2.2 years: Average number of years a woman would need long term care. – Long Term Basics & LTC Services, ALTCP
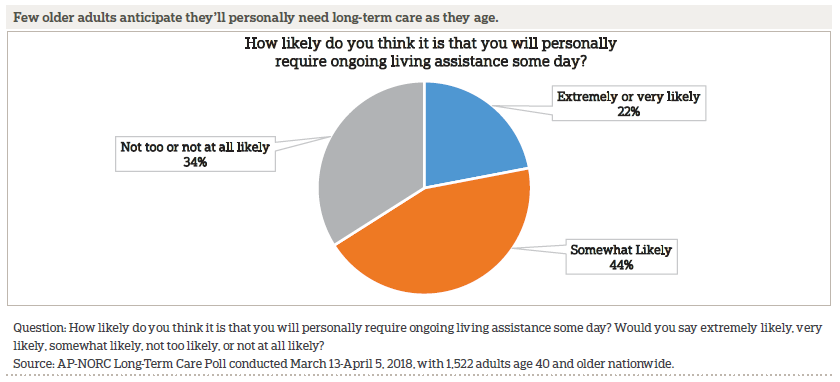
- 22%: Older adults, individuals 40 and older extremely or very likely think that they will need long term care as they age.
- 70%: Nursing home residents are women with the average age of 80 years old.
Paying for Long Term Care
- $225 billion: Long-term care expenditures in the U.S.
- $100,379: Average annual nursing home cost, private room.
- $88,348: Average annual nursing home cost, semi-private room.
- $46,350: Average annual assisted living facility cost.
- $18,746: Average annual adult day care cost.
- $49,372: Average annual homemaker services.
- $50,668: Average annual homemaker health aide services.
- 64%: 5-year compound average growth rate (CAGR) of nursing home, private room.
- 44%: 5-year compound average growth rate (CAGR) of nursing home, private room.
- 3%: 5-year compound average growth rate (CAGR) of assisted living facilities.
- 2.07%: 5-year compound average growth rate (CAGR) of adult day care.
- 2.51%: 5-year compound average growth rate (CAGR) of home health aide.
- 2.85%: 5-year compound average growth rate (CAGR) of homemaker services.
- 2.85%: Average cost of long term care in Louisiana, the cheapest state in the U.S.
- 13%; People age 64 will face over $50,000 in lifetime out-of-pocket long term care expenditures.
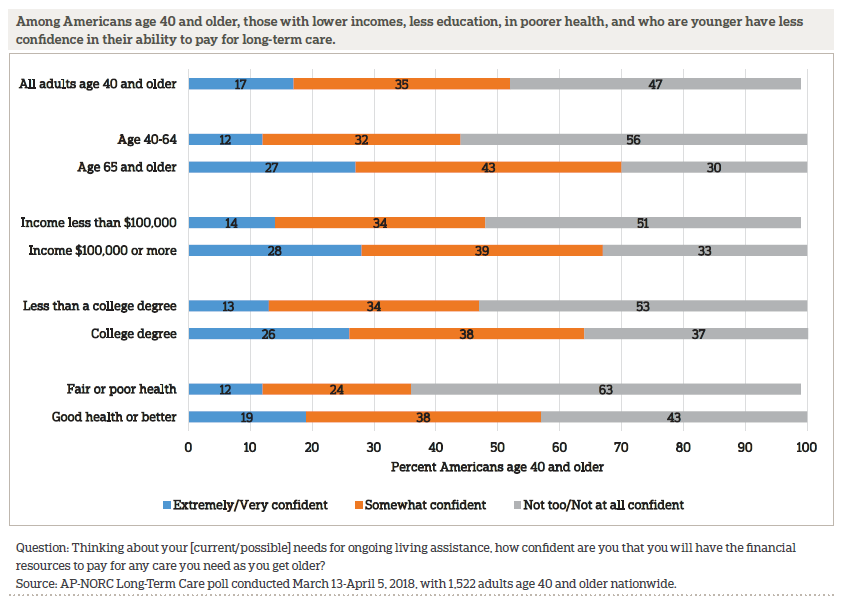
- 17%: Americans 40 and older are not too/not at all confident in their ability to pay for long term care.
- $341,840: total lifetime cost of care for someone with Dementia, with the costs associated with family care to be 70% of lifetime Dementia care costs.
- $341,840: Americans who mistakenly rely on Medicare to cover long term care needs as they age.
- One-third: Americans in their 40s have not planned for long term care.
Long Term Care Insurance
- 2 million: Americans with long term care insurance.
- $1.98 trillion: the maximum potential of all long term care insurance policies.
- 52%: Americans between 55 and 64 years old have purchased long term care insurance.
- 70%: Policyholders who are very satisfied with their policy.
- $9.2 billion: Annual claims on long term care insurance.
- $1.8 million: Largest long term care insurance claim made in 2013 and paid to a woman.
- 2: Number of daily living activities – eating, bathing, dressing, toileting, transferring/walking, and continence, you cannot perform in order to trigger your long term care insurance benefits.
- $2,645: Annual long term care insurance cost estimate of a 55-year old single male.
- $3,476: Annual long term care insurance cost estimate of a 55-year old single female.
- $2,070: Annual long term care insurance cost estimate of a couple both age 55.
- 17%: Applicants ages 50-59 denied of long term care policy due to health issues.
- 45%: Applicants ages 70-79 denied of long term care policy due to health issues.
Government Funding
- 20: Days of care in a skilled nursing facility (“rehab”) covered by Medicare following a qualifying hospital stay. If your stay lasts 21 to 100 days, you need to pay $167.50 each day starting from the 21st
- 51%: Long term care services and supports provided through Medicaid.
- 20%: Medicaid funding paid to cover long term care costs.
- 50%: Expected increase in Medicaid spending from 2016 to 2026.
Caregiving
- 60%: Female caregivers in the United States.
- 40%: Male caregivers in the United States.
- 2 million: Number of Americans who provided unpaid care to individuals 50 and up.
- 1 million: Number of caregivers for individuals with Dementia or Alzheimer’s.
- 50%: Adult children taking care of an aging mother.
- 1 in 5: Caregivers experiencing emotional stress and financial problems.
- 53%: U.S companies allow flexible working hours to accommodate individuals who provide caregiving to their loved ones.
- $470 billion: Estimated dollar value of long term care provided by unpaid caregivers.